
As a graduate student, I’m in charge of part of our lab’s open campus exhibit, but
What exactly is Wi-Fi CSI (Channel State Information)?
It’s hard to understand, not very interesting, and it seems like nobody is really interested in it anyway.
And since we’ve already exhibited the same thing twice, I decided I wanted to change the content a bit.
So, I created a 3D visualization tool for Wi-Fi CSI!
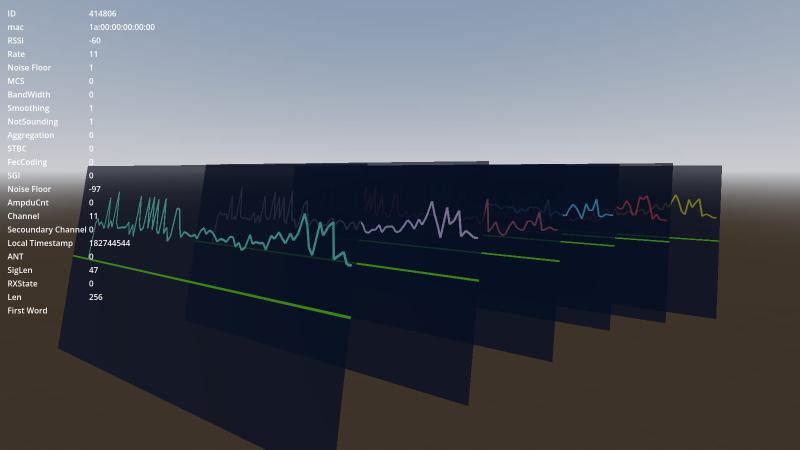
Even though it’s called 3D, Wi-Fi CSI is radio wave data, so it’s typically represented in 2D, but
here, I separated the data for each subcarrier to create layers.
Each layer vibrates slightly in response to changes in amplitude.
Check out the video here!